TB.One > Product and Article Data > Data Quality & Error Management > SolutionCenter > SolutionCenter - Dashboard
SolutionCenter - Dashboard
ATTENTION: The article error hub replaces the SolutionCenter |
#
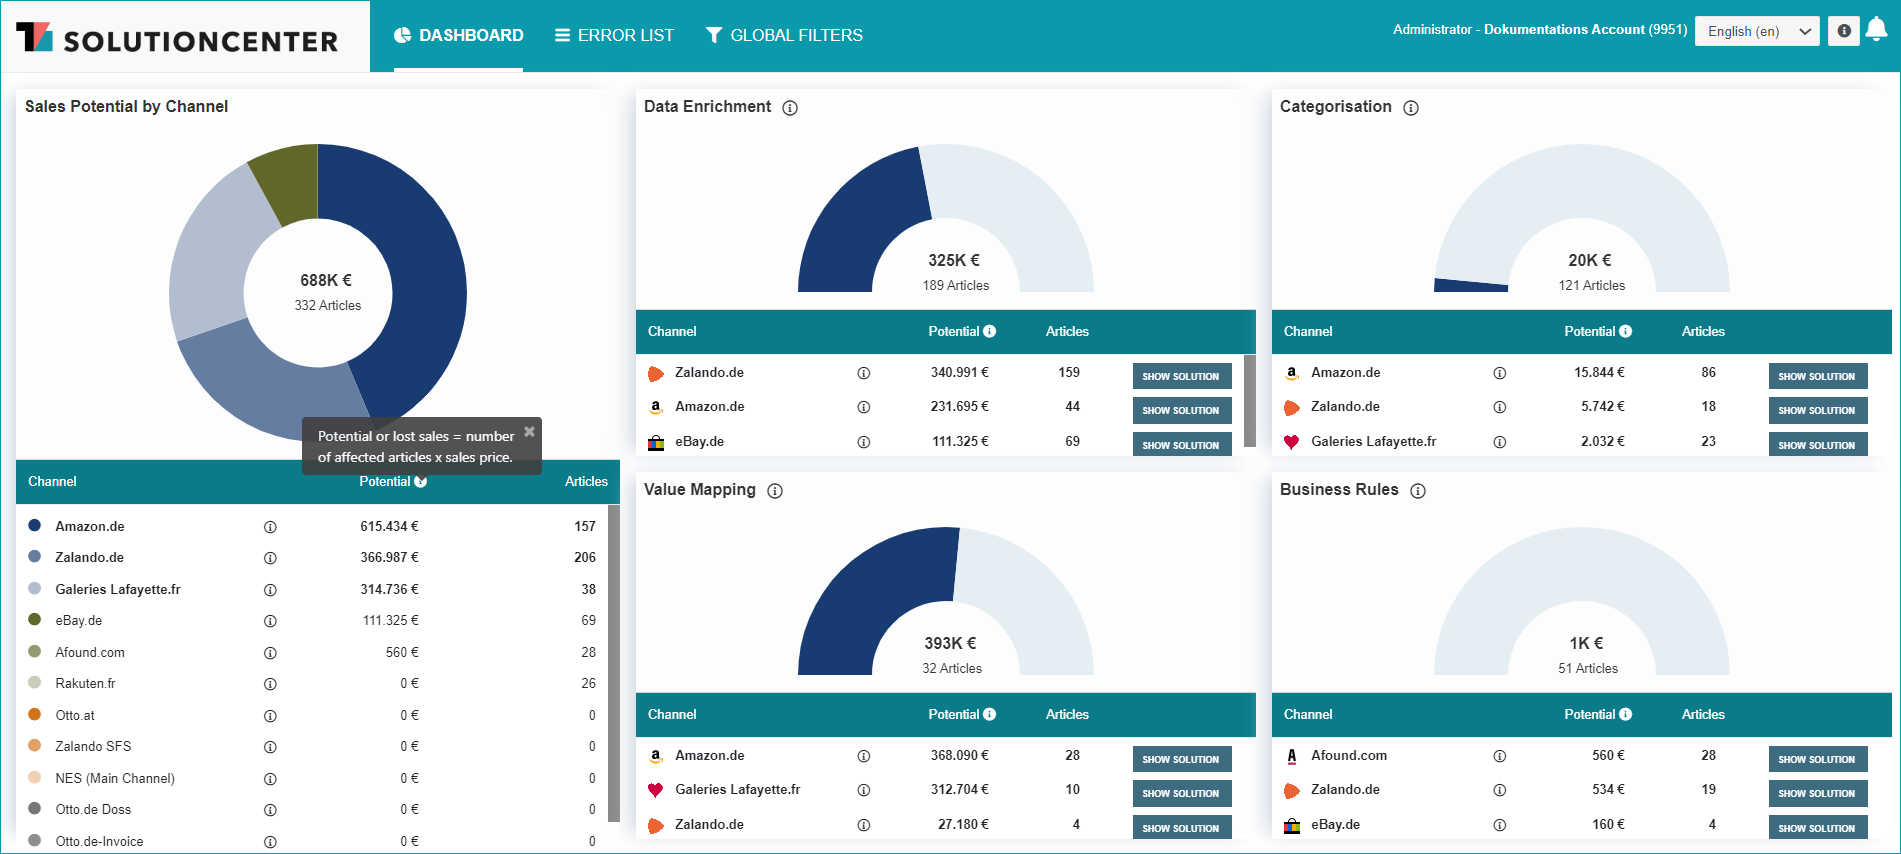
Whenever you open the SolutionCenter via TB.One ("Articles > SolutionCenter") or through the direct link (http://solutioncenter.tradebyte.com) the first menu to open will be the dashboard. Here you can see at a glance in which area the most revenue potential can be unlocked through troubleshooting. The right-hand side of the dashboard displays charts for each error section, that show how much potential revenue was lost and how many articles were not exported due to errors. Below the charts, the respective channel-specific numbers are listed. Each article is only accounted for once, even if the corresponding error affects multiple channels. Therefore, the revenue potential may be even higher than the displayed value.
Each of the channel-specific lines contains a button titled "Show solution". A click on one of these buttons will lead you to the respective channel's solution page. There, you can read about the errors' causes and their solutions, and will find step-by-step instructions for dealing with the corresponding problem.
If there are currently no errors in a section, the respective field will show a green checkmark.
On the left side of the menu, there is an additional pie chart that shows the combined errors for all sections by channel.
For further information, see also:
•SolutionCenter - overview
•Proof of data quality - overview