TB.One > Order Data and Order Processing > Statistics and Dashboard > Order Statistics
Order Statistics
TIP: If you need long-term insights, TB.360 provides up to 36 months of historical data. |
The statistics menu at "Home > Statistics > Orders" (or under "TB.One > Statistics") is divided into three sections. The upper section can be used to filter the list, which is displayed in the middle section. The section at the bottom is used to export the list.
Via the tabs you can access statistics regarding orders, cancellations, dispatch advices, returns, articles, brands, return causes or flags. The settings and options in the three menu sections are similar on each tab.
1. FILTER SECTION
The general type of information displayed in the list is determined by the tab (orders, cancellations, dispatch advices, etc.). In the default filter setting, all order items for the current month will be displayed (irrespective of the channel).
Use the drop-down menu "Channel" to limit the list based on one or multiple channels. By default, the current month is selected as the evaluated time period. If necessary, you can choose a different time frame via the drop-down menu "Period of time". If you set the menu to "-- free period --", you need to select a start and end date in the fields to the right of the drop-down.
The field "Base" is related to the field "Period of time". Here, you can define the "Order date" (default setting; refers to the date an item was ordered at the channel) or the "Creation date" (refers to the date an order was created in TB.One) as the point of reference.
If you have added flags to your products or articles, you can use them to filter the list. The drop-down menu "Flags" contains all flags that were created in TB.One.
Depending on the tab, other filters such as "order status", "return cause" or "cancellation reason" may be available to you. Confirm the settings by clicking the "Filter" button.
ATTENTION: |
2. LAB "DISPOSITION VIEW AT STATISTICS"
Via "Admin > Labs" different functions that are new and not complete yet can be tested. This does also include the lab "Disposition view at statistics".
Once the lab "Disposition view at statistics " is activated, the two tabs "Products" and "Articles" are combined to a disposition view as seen below in one tab. Here, you will find information on turnover, stock, rates and sales quantity.
TIP: |
3. LAB "STORABLE STATISTICS FILTER"
In the menu "Admin > Labs", several features that are not necessarily complete yet can be activated. Among other things, the "Storable statistics filter" can be activated.
If the option is active, you can save the configuration of your filters permanently. Click on the button "Save" after you have applied the settings. Saved profiles can be selected form the drop-down menu "Filter profile" and can be removed by clicking the "Delete" button.
TIP: If you apply a stored filter and export the resulting statistics, the exported file's name shows what filter was used and what type of statistics the file contains. If the lab "Storable statistics filter" is active, you can configure regular automated statistics exports based on your stored filters by switching to the tab "Automated exports", opening the left sidebar on the tab "Pages" and clicking on "Create new export". |
4. LIST SECTION
The list resulting from the filter settings is displayed in the middle section of the window.
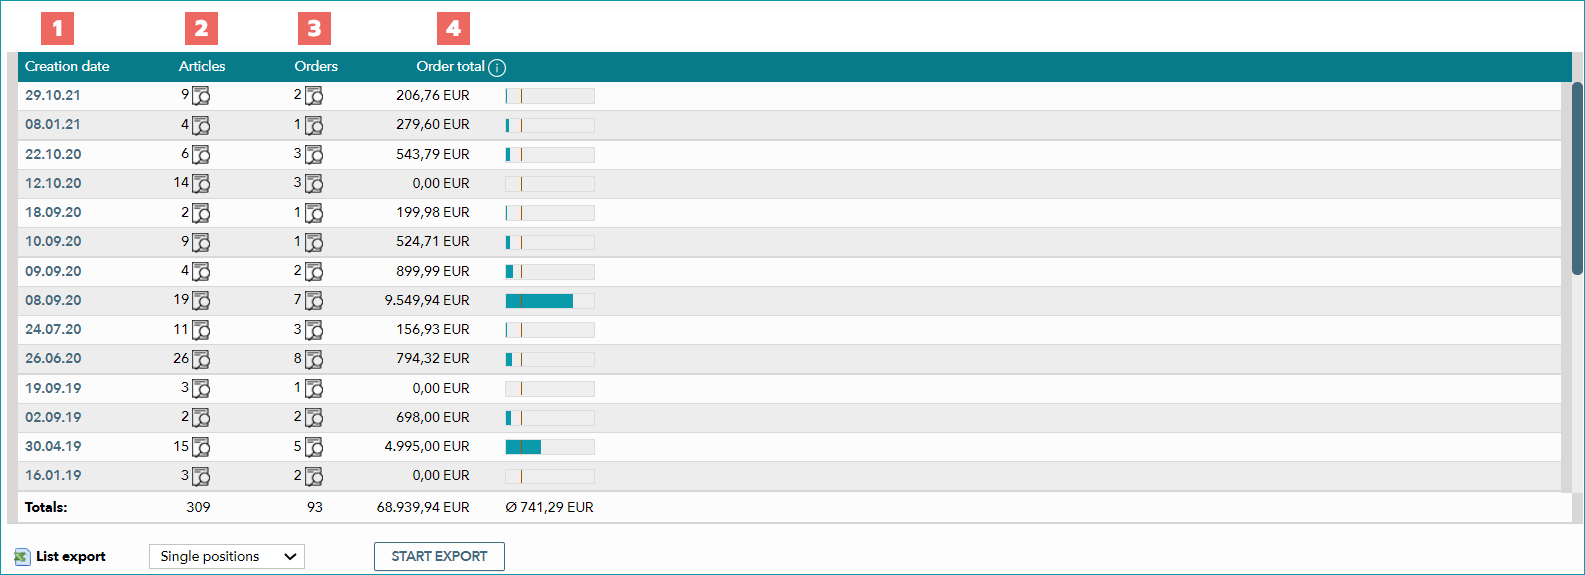
NUMBER |
DESCRIPTION |
|---|---|
|
Displays the creation or order date (dependent on the drop-down "Base" in the filter section). Clicking on a date will automatically set the filter period to that date (the list will be reduced to the selected day). |
|
The number of related articles is displayed here. A click on the magnifying glass icon will open a new window containing a list of these articles. You can open article previews and navigate directly to the article from this window.The column "Channel activation" displays all channels, which are active for an article. |
|
This columns shows the number of orders. A click on the magnifying glass icon will open a new window containing a list that shows the orders. |
|
The value of all related orders is added and displayed in the column "Order total" (shipping and payment costs are not taken into account). Amounts in foreign currencies will be converted to Euro. Conversion rates are automatically retrieved from the ECB (European Central Bank) and can be viewed at "Basic data > Prices > Exchange rates". In each row, the blue bar represents the order total in relation to the highest order total in the list. A vertical red line indicates the average total value of all orders. |
The added values of each column are displayed in the line "Totals" below the list.
TIP: If you have a great number of active channels for an article, it may be advisable group their flags. To group the channel flags, access your display settings via "Admin > System Settings > User Interface" (see "personalize TB.One") and activate the checkbox "Group channel flags" under "Display and input fields". The menu then displays the total number of channels instead of the individual channel flags. Hover the cursor over the number to display a list of all channels. |
5. EXPORT SECTION
In the lower section of the menu, you can trigger exports. You can choose to group the contents of the exported file by date or article. If you select "Single positions" from the drop-down menu, each order item will be listed individually, along with some order and article details. Grouping according to article will list the articles and quantities with the total RP. Grouping by date will list the total number of orders and ordered articles for that day, along with the order statuses and the corresponding number of orders for each status.
ATTENTION: |
If you would like the consignee and/or recipient of the invoice to be listed in the order export ("Single positions" only), activate the corresponding setting at "Admin > System settings > Order processing".
In the export settings ("Admin > Export > List exports") you can choose whether to export lists as XLS, XLSX or CSV. This setting will affect all users.
For further information, see also: